This work is a continuation of my 2013 and 2016 papers as described here
import xarray as xr
import numpy as np
import pandas as pd
import matplotlib.pyplot as plt
import cartopy.crs as ccrs
from skimage.feature import peak_local_max
Read in gridded monthly mean data for period 1979-2018
ds   = xr.open_dataset('~/DATA/ERAI/erai_Surface_MonthlyMeansFromDaily.nc')
mask = xr.open_dataset('~/DATA/ERAI/erai_invariant.nc').lsm.squeeze()
da = ds.msl
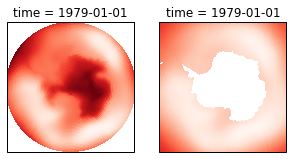
Apply land-sea mask
da_mask = da.where(mask == 0)
da_mask.mean().values, da.mean().values # these are different, great!
(array(64511.23828125), array(42718.0625))
da = da.sel(latitude=slice(-55,-90))
plt.figure(figsize=(5,5))
ax1 = plt.subplot( 121, projection=ccrs.Stereographic(central_longitude=0., central_latitude=-90.) )
ax1.set_extent([-180,180,-90,-55], ccrs.PlateCarree())
da.isel(time=0).plot.pcolormesh( 'longitude', 'latitude', cmap='Reds',
                                        transform=ccrs.PlateCarree(), add_colorbar=False )

ax2 = plt.subplot( 122, projection=ccrs.Stereographic(central_longitude=0., central_latitude=-90.) )
ax2.set_extent([-180,180,-90,-55], ccrs.PlateCarree())
da_mask.isel(time=0).plot.pcolormesh( 'longitude', 'latitude', cmap='Reds',
                                        transform=ccrs.PlateCarree(), add_colorbar=False )
<matplotlib.collections.QuadMesh at 0x1c48375d30>
Definitions to identify areas of low pressure
def get_lows(da, threshold=None):

    invert_data = (da*-1.).values     # search for peaks rather than minima

    if threshold is None:
        threshold_abs = invert_data.mean()
    else:
        threshold_abs  = threshold * -1  # define threshold cut-off for peaks (inverted lows)

    minima_yx = peak_local_max(invert_data,            # input data
                           min_distance=4,             # peaks are separated by at least min_distance
                           num_peaks=6,                # maximum number of peaks
                           exclude_border=True,        # excludes peaks from within min_distance - pixels of the border
                           threshold_abs=threshold_abs # minimum intensity of peaks
                           )
    return minima_yx


def sector_mean(da, dict):
    a = da.sel( latitude=slice(asl_region['north'],asl_region['south']),
                longitude=slice(asl_region['west'],asl_region['east']) ).mean()
    return a


def get_asl(da, region, mask):
    '''
    da for one point in time (with lats x lons)
    '''

    lons, lats = da.longitude.values, da.latitude.values

    threshold = da.sel( latitude=slice(region['north'], region['south']),
                        longitude=slice(region['west'], region['east']) ).mean().values

    time_str = str(da.time.values)
    sec_pres = sector_mean(da.where(mask == 0), region).values

    # fill land in with highest value to limit lows being found here
    da_max   = da.max().values
    da       = da.where(mask == 0).fillna(da_max)

    ### get lows for entire domain
    minima_yx = get_lows(da, threshold)

    minima_lat, minima_lon, pressure = [], [], []
    for minima in minima_yx:
        minima_lat.append(lats[minima[0]])
        minima_lon.append(lons[minima[1]])
        pressure.append(da.values[minima[0],minima[1]])

    df = pd.DataFrame()
    df['lat']      = minima_lat
    df['lon']      = minima_lon
    df['pressure'] = pressure
    df['ASL_Sector_Pres'] = sec_pres
    df['time']     = time_str

    ### select only those points within ASL box
    asl_df = df[(df['lon'] > region['west'])  &
                (df['lon'] < region['east'])  &
                (df['lat'] > region['south']) &
                (df['lat'] < region['north']) ]

    ### For each time, get the row with the lowest minima_number
    asl_df = asl_df.loc[asl_df.groupby('time')['pressure'].idxmin()]

    return asl_df
Define area we are interested in
asl_region = {'west':170., 'east':298., 'south':-80., 'north':-60.}
Loop through all times and identify lows
record these data in a Pandas DataFrame
ntime      = da.time.shape[0]

all_lows_df = pd.DataFrame()
asl_df      = pd.DataFrame()

for t in range(0,ntime):
    da_t   = da.isel(time=t) / 100.
    asl_df = pd.concat([asl_df, get_asl(da_t, asl_region, mask)]).reset_index(drop=True)
Show the first 7 rows
asl_df.iloc[0:7]
| lat | lon | pressure | ASL_Sector_Pres | time | |
|---|---|---|---|---|---|
| 0 | -69.75 | 219.00 | 982.376343 | 986.091736 | 1979-01-01T00:00:00.000000000 |
| 1 | -71.25 | 196.50 | 973.704346 | 982.958923 | 1979-02-01T00:00:00.000000000 |
| 2 | -69.75 | 225.00 | 972.301636 | 980.515076 | 1979-03-01T00:00:00.000000000 |
| 3 | -68.25 | 273.75 | 967.706482 | 979.388428 | 1979-04-01T00:00:00.000000000 |
| 4 | -70.50 | 191.25 | 977.467529 | 987.170654 | 1979-05-01T00:00:00.000000000 |
| 5 | -70.50 | 219.00 | 966.901245 | 977.857605 | 1979-06-01T00:00:00.000000000 |
| 6 | -71.25 | 249.75 | 972.692871 | 980.135132 | 1979-07-01T00:00:00.000000000 |
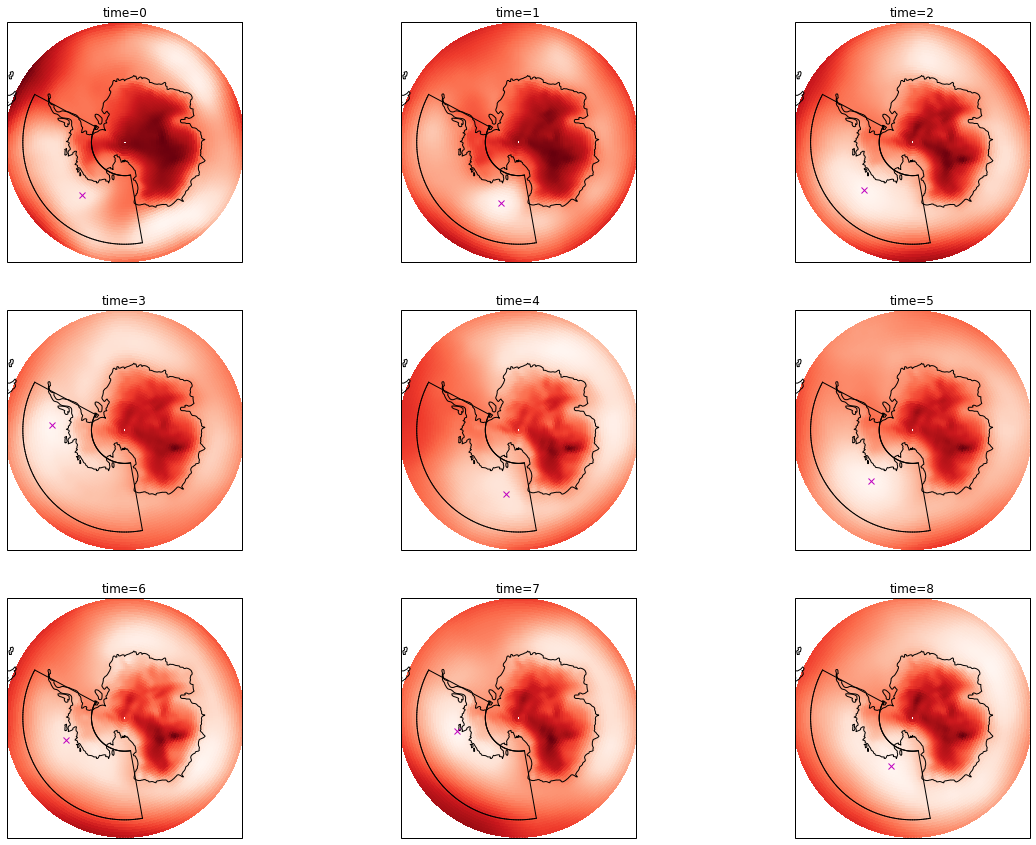
Plotting: location of minimas in pressure field
def draw_regional_box( region, transform=None ):
    '''
    Draw box around a region on a map
    region is a dictionary with west,east,south,north
    '''

    if transform == None:
        transform = ccrs.PlateCarree()

    plt.plot([region['west'], region['west']], [region['south'],region['north']],
                 'k-', transform=transform, linewidth=1)
    plt.plot([region['east'], region['east']], [region['south'],region['north']],
                 'k-', transform=transform, linewidth=1)

    for i in range( np.int(region['west']),np.int(region['east']) ):
        plt.plot([i,i+1], [region['south'],region['south']], 'k-', transform=transform, linewidth=1)
        plt.plot([i,i+1], [region['north'],region['north']], 'k-', transform=transform, linewidth=1)
plt.figure(figsize=(20,15))

for i in range(0,9):

    da_2D = da.isel(time=i)

    ax = plt.subplot( 3,3,i+1,
                        projection=ccrs.Stereographic(central_longitude=0.,
                                                      central_latitude=-90.) )

    ax.set_extent([-180,180,-90,-55], ccrs.PlateCarree())

    result = da_2D.plot.pcolormesh( 'longitude', 'latitude', cmap='Reds',
                                    transform=ccrs.PlateCarree(),
                                    add_colorbar=False )

    ax.coastlines(resolution='110m')
    ax.set_title('time='+str(i))

    ### mark ASL
    df2 = asl_df[ asl_df['time'] == str(da_2D.time.values)]
    plt.plot(df2['lon'], df2['lat'], 'mx', transform=ccrs.PlateCarree() )

    draw_regional_box(asl_region)

print('')