Overview
West Antarctica has experienced rapid environmental change over recent decades, and scientists have linked observed patterns in surface temperature and sea ice to the Amundsen Sea Low (ASL) — a highly dynamic and mobile climatological low pressure system located in the Pacific sector of the Southern Ocean.
Research by Hosking et al. (2013) demonstrated that the position and strength of the ASL are crucial for understanding regional change over West Antarctica. Climate models that perform well at simulating the ASL also tend to better represent regional surface conditions. The original paper used the term "Amundsen-Bellingshausen Seas Low (ABSL)" but terminology was updated following an ASL workshop.
ASL Indices
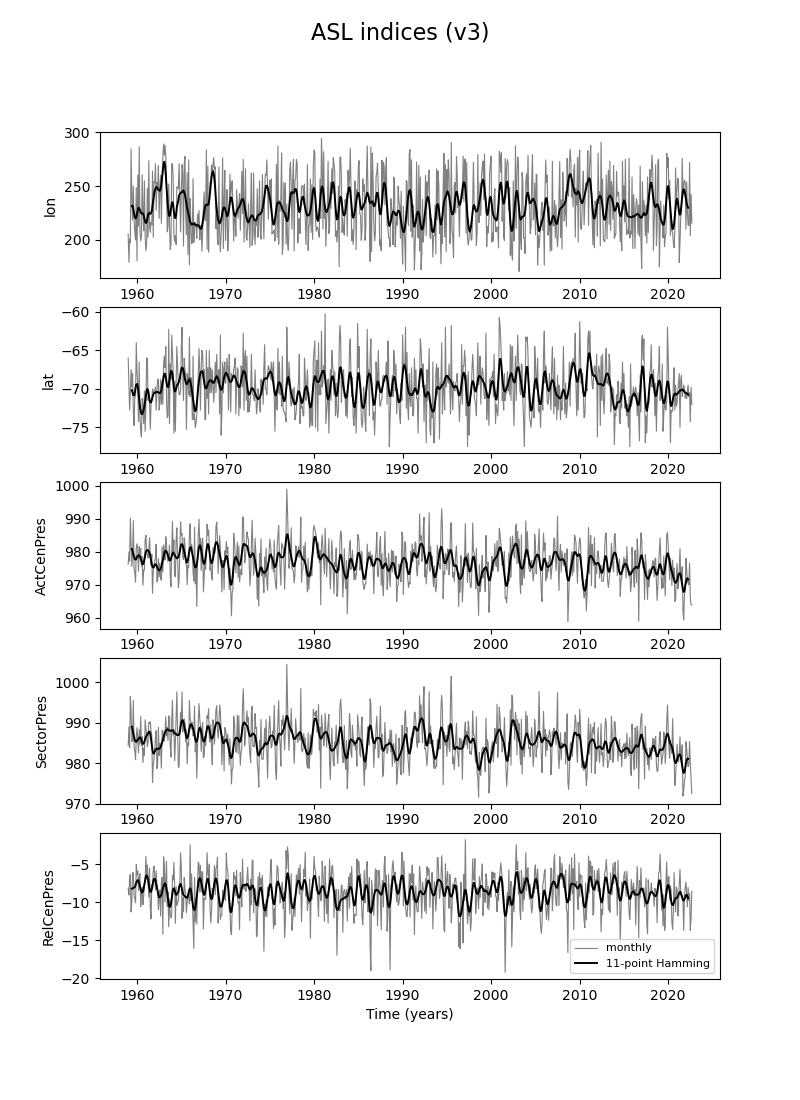
Three complementary indices are used to characterise the ASL from monthly ERA5 mean sea level pressure data, within the sector 170°–298° E, 80°–60° S.
ASL Latitude & Longitude
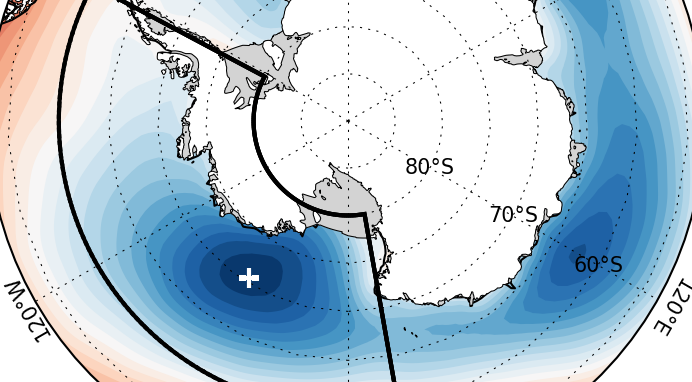
The central location of the ASL is identified using a minima-finding algorithm applied to monthly ERA5 mean sea level pressure data within the sector 170°–298° E, 80°–60° S.
ASL Actual Central Pressure
Simply defined as the pressure at the ASL location. This index is strongly modulated by the Southern-Hemisphere Annual Mode (SAM).
ASL Relative Central Pressure
Essentially a regional pressure anomaly. It is calculated by subtracting the ASL actual central pressure from the area-averaged pressure over the ASL domain, isolating the local circulation signal from the hemispheric SAM signal.
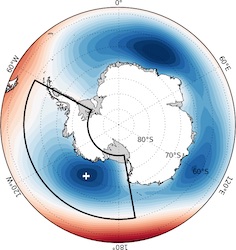
Regional Map
Monthly Timeseries
Data & Resources
All index data and code are freely available, including the asli package. The CSV dataset covers 1959-01 to present and is updated monthly.
Key Publications
Hosking, J.S., Orr, A., Bracegirdle, T.J., & Turner, J. (2016). Future circulation changes off West Antarctica: Sensitivity of the Amundsen Sea Low to projected anthropogenic forcing. Geophysical Research Letters, 43. doi:10.1002/2015GL067143